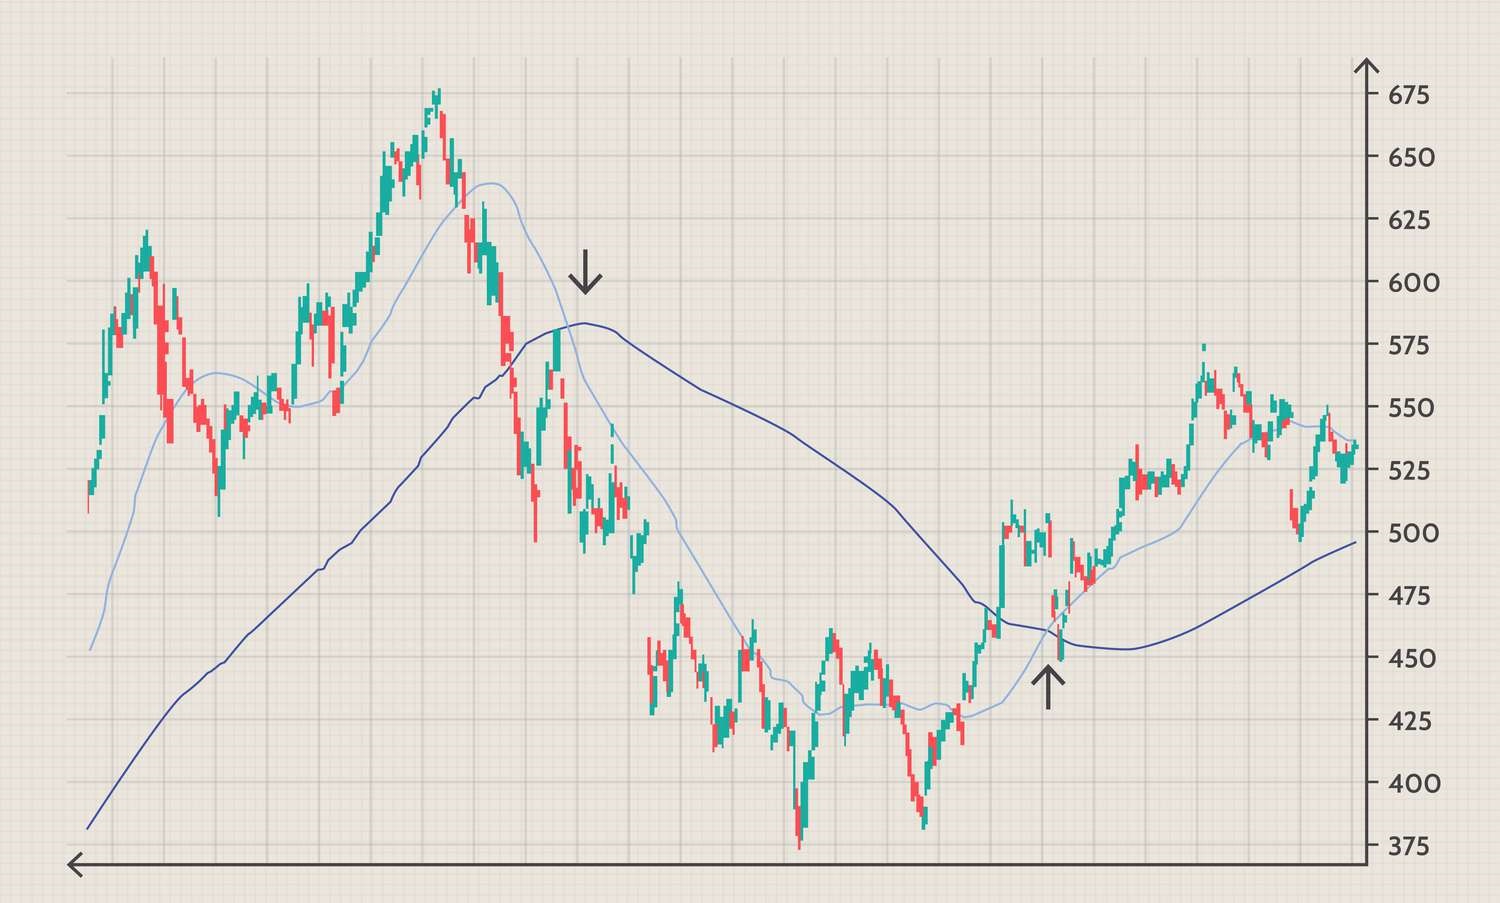
Ever wondered how traders predict market trends? The 200-day moving average and shorter-term moving averages are key tools. They each offer unique insights, from long-term stability to quick market reactions. Understanding these differences can enhance your trading strategy and boost your financial savvy. Ready to dive in? Register at the main website of FBC Algo and learn in depth about trading and concepts related to it.
The 200-Day Moving Average: A Long-Term Perspective
The 200-day moving average (MA) is like the seasoned navigator of the trading world, guiding investors through the ups and downs of the market. By averaging the closing prices over the past 200 days, it provides a steady trend line that helps us see the broader picture. Why is it so popular? It’s simple: it smooths out the daily noise, allowing traders to focus on the overall direction.
This long-term indicator is especially useful for identifying major trends. For instance, when the price stays above the 200-day MA, it signals a bullish market, suggesting it’s a good time to buy. Conversely, if the price falls below this line, it might be time to sell. Many investors use it to make decisions about entering or exiting the market, avoiding the pitfalls of short-term volatility.
Consider how this worked during the 2008 financial crisis. Those who paid attention to the 200-day MA likely avoided significant losses by exiting the market when prices dipped below this line. Similarly, during the recovery, re-entering the market as prices crossed back above the 200-day MA would have been a smart move.
Is this method foolproof? No, but it’s a solid tool in an investor’s toolkit. It offers a bird’s-eye view of the market, helping to navigate the financial seas with a bit more confidence. Have you ever used the 200-day MA in your trading strategy? It might be worth considering for a steadier hand in turbulent markets.
Shorter-Term Moving Averages: Flexibility and Precision
Shorter-term moving averages, like the 50-day or 20-day MAs, are the quick responders in the trading toolbox. They react faster to market changes, making them perfect for those who like to stay on their toes. These averages track the market more closely, giving timely signals that are crucial for short-term strategies.
The 50-day MA, for example, smooths out the price data over the last 50 days. It’s more sensitive to recent price movements, helping traders catch trends early. If a stock’s price crosses above its 50-day MA, it often signals a buying opportunity. On the flip side, if it dips below, it might be time to sell.
Let’s take the tech stock boom of the early 2020s. Traders using the 20-day MA could catch the rapid upward trends and ride the wave, making profits as prices surged. However, these short-term averages can be volatile. They might give false signals, leading to hasty decisions. That’s why some traders use a combination of short and long-term averages to confirm trends and reduce risks.
Have you ever felt the rush of a quick trade, thanks to a short-term MA? It’s like having a magnifying glass on the market’s heartbeat, giving you a sharper, more immediate view of what’s happening. But remember, with great power comes great responsibility. Balancing speed and accuracy is key.
Comparative Analysis: 200-Day vs. Shorter-Term Moving Averages
Trend Identification and Market Phases
When it comes to spotting trends, the 200-day and shorter-term moving averages play different roles. The 200-day MA is your go-to for identifying long-term trends. It helps in recognizing sustained market directions, filtering out short-term noise. If you’re an investor looking to hold onto stocks for months or years, this is your compass.
In contrast, shorter-term MAs like the 50-day or 20-day averages are ideal for catching shorter market cycles. They respond quickly to price changes, making them useful for traders focused on shorter periods, from days to a few weeks. Have you noticed how a stock might fluctuate wildly in the short term but shows a steady trend when viewed over months? That’s the difference in action.
Sensitivity to Market Fluctuations
The 200-day MA is less sensitive to daily market fluctuations. This makes it reliable for filtering out the market’s daily noise. During the COVID-19 pandemic’s initial shock in 2020, while short-term MAs swung wildly, the 200-day MA provided a steadier view, helping investors avoid panic.
Shorter-term MAs, however, are more sensitive and can quickly signal potential opportunities or risks. This sensitivity is a double-edged sword. It allows for timely responses but can also lead to over-trading if one reacts to every minor movement. Do you prefer a steady hand or a rapid response? Your trading style will determine your choice.
Signal Lag: A Comparative Perspective
Signal lag is a critical factor in moving averages. The 200-day MA has a notable lag, meaning it takes longer to signal changes because it averages a large number of data points. This lag is beneficial for avoiding false signals in volatile markets but can delay action in fast-moving markets.
Shorter-term MAs, with their smaller data sets, provide quicker signals. They are quicker to reflect current market conditions, making them suitable for traders who need to act fast. However, this quickness can also result in false signals, requiring a careful and experienced eye to interpret them correctly.
Conclusion
Grasping the nuances between the 200-day moving average and shorter-term moving averages can transform your trading approach. Whether you’re in it for the long haul or prefer quick trades, these tools provide valuable market insights. Keep learning, stay adaptable, and consider consulting financial experts to refine your strategy. Happy trading!
